Reviewing Logs in cPanel
Updated on Sep 7, 2018
Another important part of the cPanel is the Metrics Section which contains several tools to review the activity on your website and hosting account.
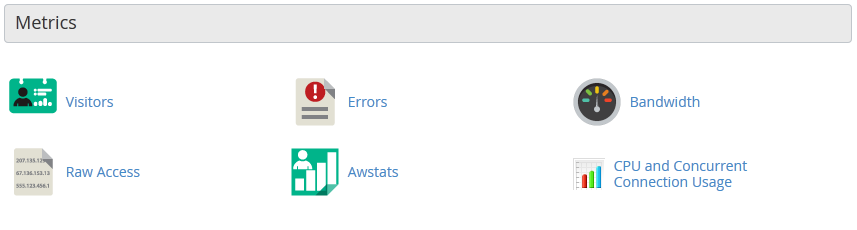
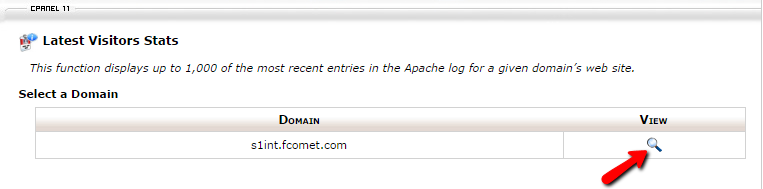
The first tool available under the Metrics section is the Visitors icon. This feature displays up to 1000 of the most recent entries in the web server log for any of your configured domains. To review the logs simply click on the icon next to your domain name.
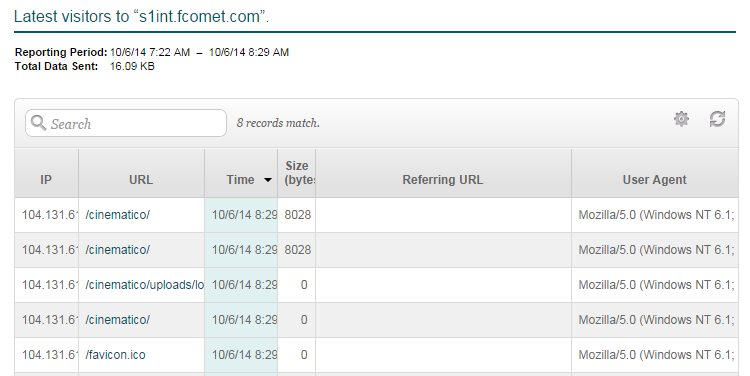
This will display the latest lines of your access logs which include the IP address of your website visitor, the exact URL, the request date, request size, referring URL and the visitor's user agent.
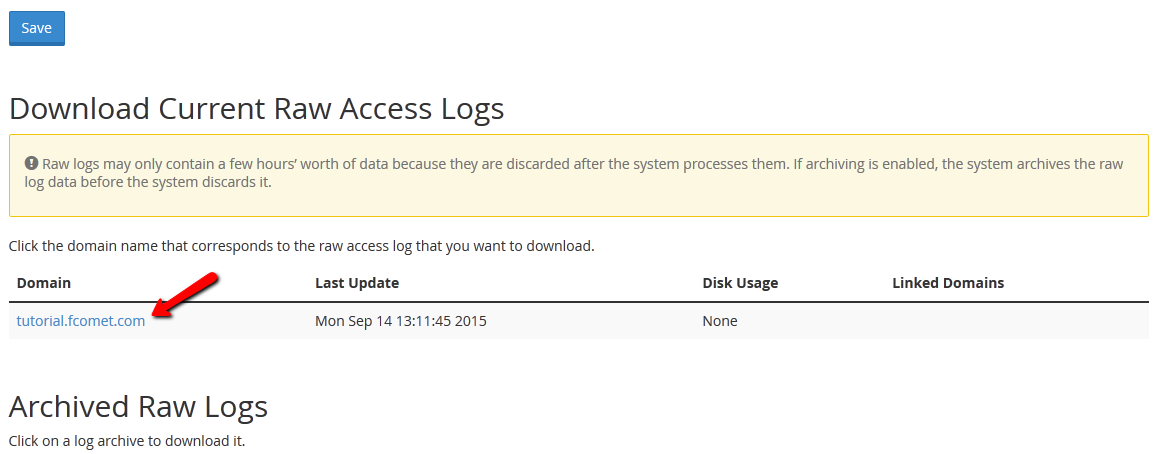
Another useful icon in the cPanel Metrics section is the Raw Access Logs icon. Raw Access allow you to see who has visited your website without displaying graphs, charts or other graphics. You can use the Raw Access menu to download a zipped version of the server's access log for your site. This can be very useful when you want to quickly be able to see who is visiting your site.
To download the Raw Access log of your domain name simply click on the domain name from the Download section.
If you are debugging your application or script and need access to your error log, the cPanel Error Log icon can be a good start.
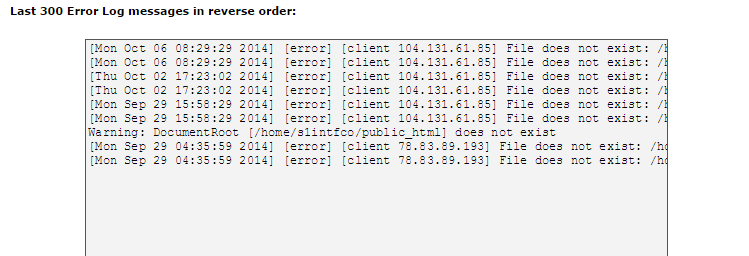
It will display the last 300 lines of your site's error log with the exact date and error type as well as the IP address of the visitor that generated the error.

cPanel Hosting
- Free Domain Transfer
- 24/7 Technical Support
- Fast SSD Storage
- Hack-free Protection
- Free Script Installation
- Free Website Transfer
- Free Cloudflare CDN
- Immediate Activation