Beta: Observer Monitoring System is Now Live
We are excited to officially announce a new and very important project for us – The Observer Monitoring system is now live in beta and fully accessible via the Client Area for all shared hosting packages. The new system provides 360-degree information on all core hosting account resources to help our clients get the most of their hosting plan.
Why This Is a Big Step Forward
After evaluating all reported performance, stability and internal issues with our shared hosting environment, we have noticed that almost all of the incidents were a result of incorrectly maintained hosting accounts or some sort of resource over-usage. As a result, our technical support team was continuously engaged in handling abuse cases which usually ended with frustration for our clients.
Furthermore, this process was time-consuming and our efforts were not concentrated on preventing but solving problems. Even more surprisingly, during the communication with our clients, we always came to the same conclusion – almost all clients did not cause the issue intentionally and most of the abuse cases were a result of malfunctioning software or an event for which they were not aware of such as spambots, malware, hacks or other malicious activity.
To address this we came to the conclusion that the monitoring process on the infrastructure level is just not enough. To actually prevent problems, instead of just reacting, we needed to monitor each of the hosting accounts individually and provide the necessary tools and information to our clients in advance. That’s why we are discontinuing the Abuse cases and the old way we are handling things.
We believe that you, our clients, can prevent such issues by being informed and empowered by tools that will help you maintain your account in good health. Instead of just monitoring the hosting environment for you, we would like to create this two-sided process, in which you will be actively involved, so together we can not only maintain but also optimize your website performance, help you utilize account resources in a better way and reduce your costs for hosting services by eliminating the bottlenecks and issues along the way.
Diving Into Observer Monitoring Dashboard
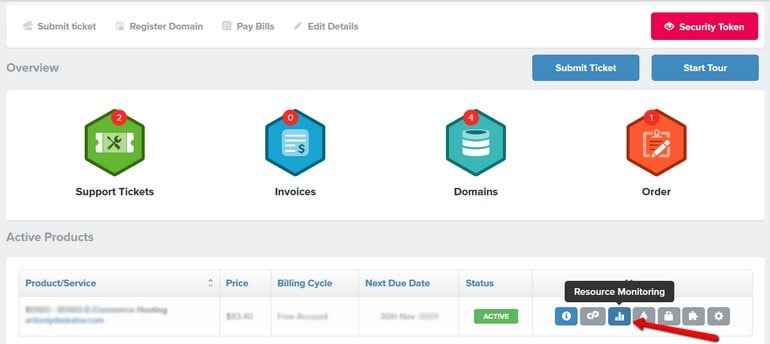
Upon logging into the Client Area of your active account with us, you would need to navigate to the Activate accounts section at the Client Area Index page. To dive into the more in-depth reports you will want to click on “Resource Monitoring” button next to the cPanel shortcut icon.
How Being a Good Neighbor Can Actually Make Your Site Faster
As you know, the shared hosting environment is a place where other people host their projects just like you. Being a good neighbor in the web hosting space is just like any other area – it makes everyone happier, including you, and here is how.
The Core Resource Allocation Widget
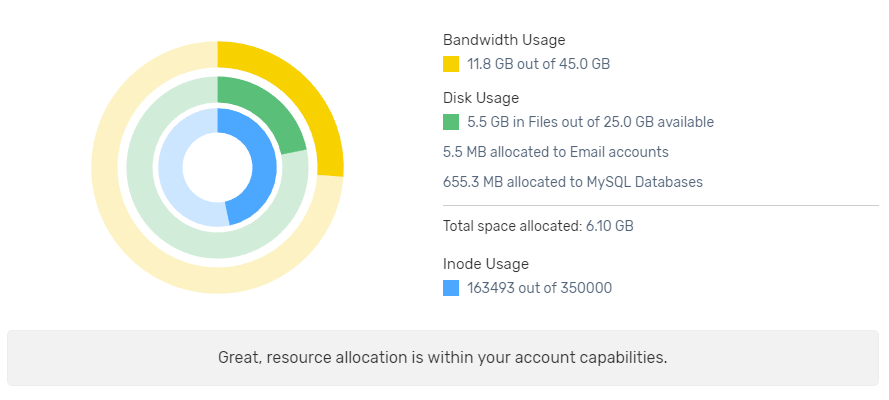
The core resource allocation widget gives you a quick overview of your Bandwidth and Disk allocation. You may have never considered it but maintaining your account disk and inode usage may significantly improve performance. Do you store a large number of cache files or old backups? Have you recently checked the size of your email accounts trash and spam folders? All these things increase the time needed for your account to back up and restore, mail account indexing, FTP, and IMAP performance. You can dive deeper into the available statistics for your account following the steps in our tutorials:
It is always a good idea to keep your hosting account clean and tidy which will be very beneficial to all your hosting neighbors and your website. Additionally, if you notice that your Inode usage is mysteriously growing your application may be malfunctioning by creating a large number of the temporary, cache or dump files that slow down your website and can be one of the main reasons for downgraded performance. Keep an eye on these resources to make sure your web applications and services work as intended.
The Bandwidth Histogram
The bandwidth histogram is another tool available in your Observer monitoring system that can help you identify any unusual behavior or traffic spikes.
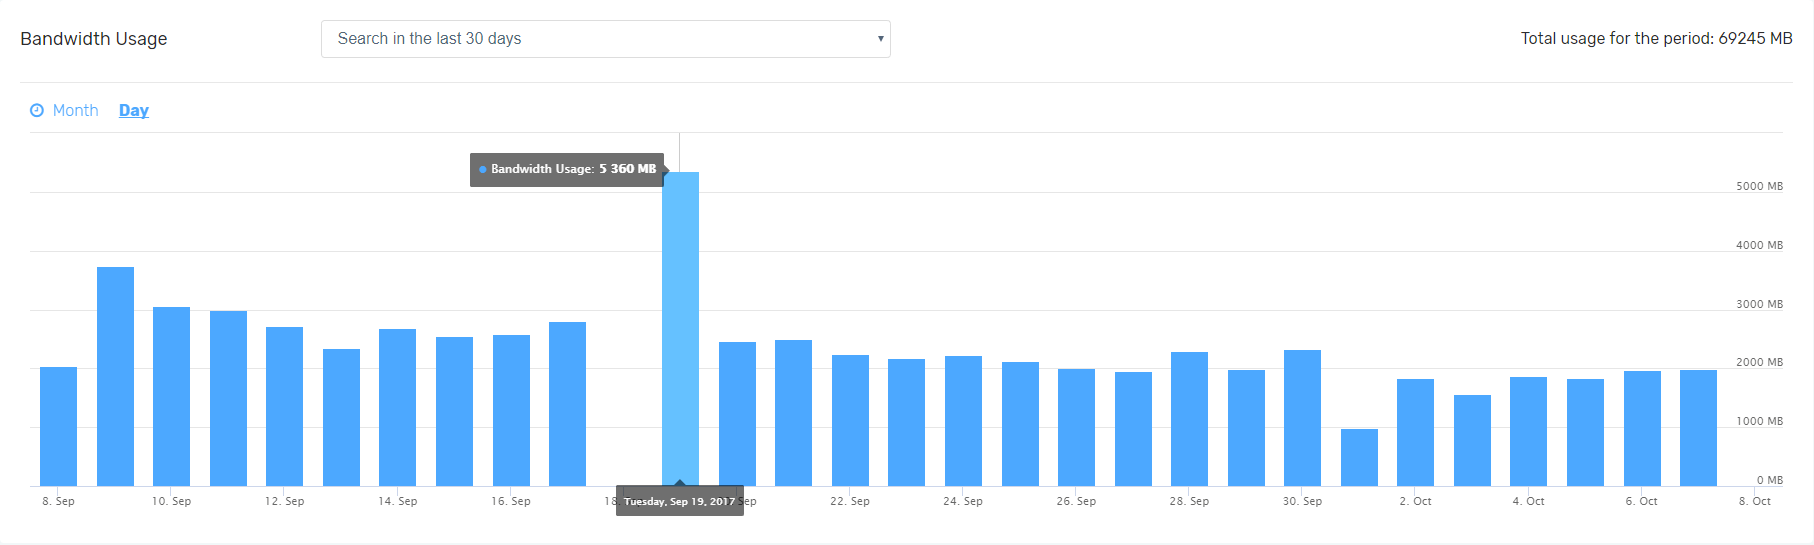
Having spikes or constantly growing bandwidth usage? Why not optimizing it to speed up your websites. Here is how you can do that:
- Active a Content Delivery Network for faster static content delivery
- Review your bandwidth usage and access statistics
- Block unwanted traffic or consider enabling hotlink protection
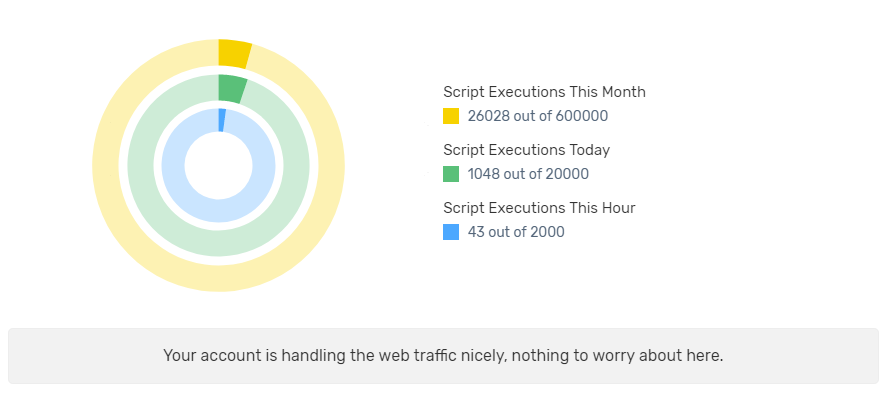
The Script Executions widget
Knowing your exact bandwidth usage combined with the next widget can also help you determine the best hosting plan for your website to avoid overspending. The Scripts Execution widget gives you the exact number of scripts executed in this month, today and current hour. It is also updated in real-time so you can detect any unusual activity right away.
If you need a more detailed view of your script executions, you may review the histogram also available in the Observer Monitoring system. It provides a record of every single script execution under your hosting account. Now you can see how your websites are doing and identify your busiest hours of the day, how your traffic is distributed through the week or what exactly happened in that minute when your site got slow.
Script Executions Histogram
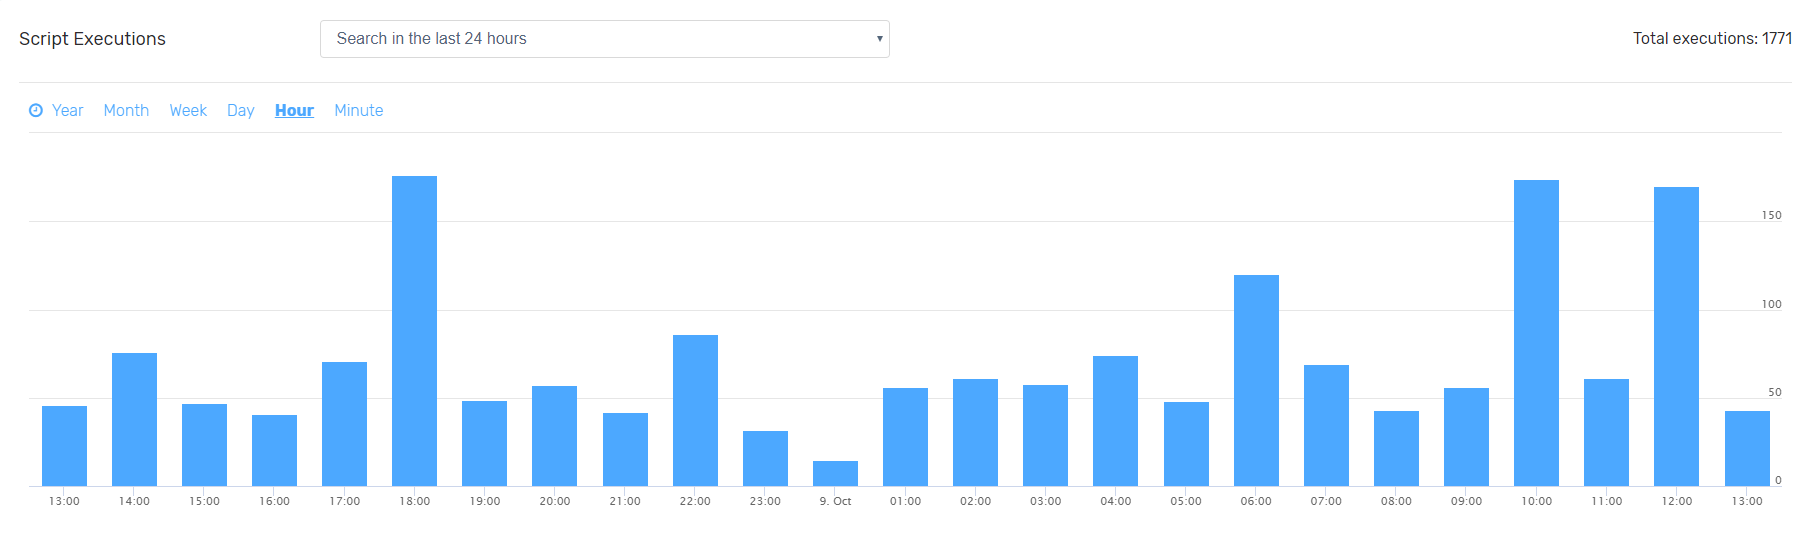
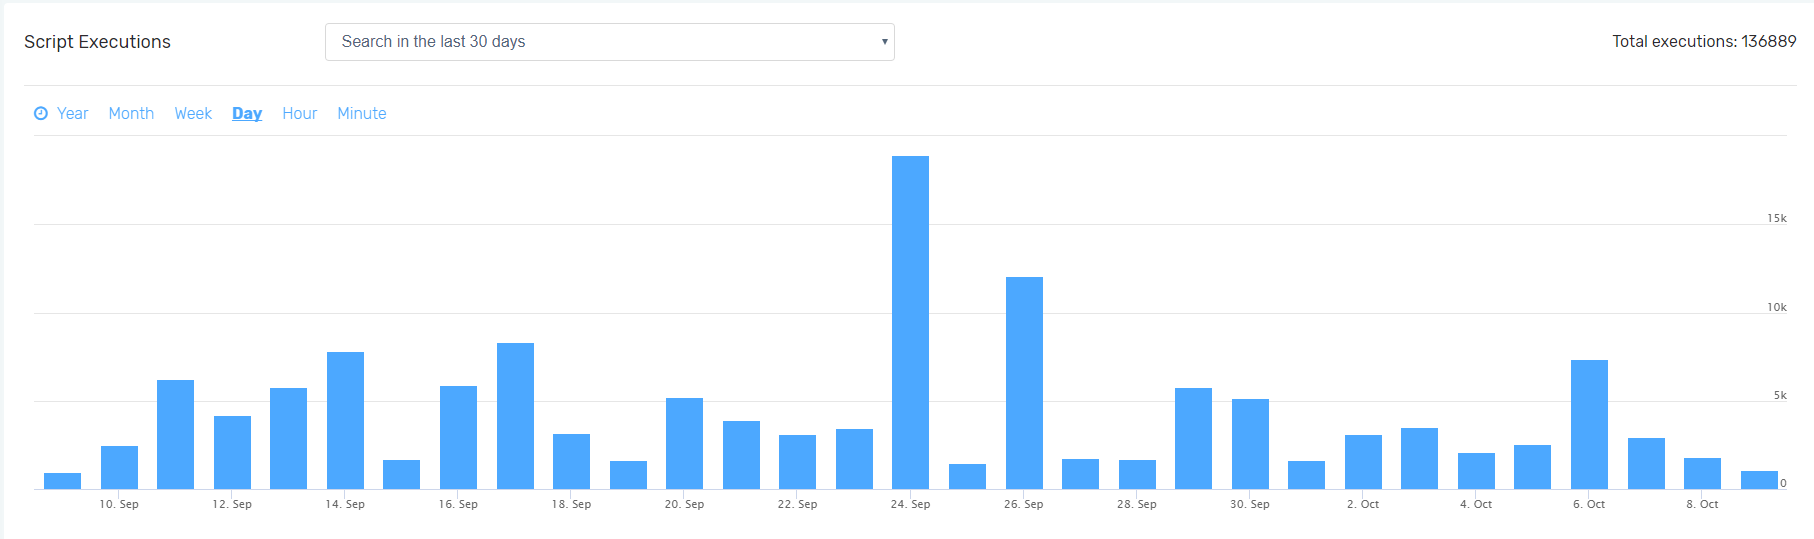
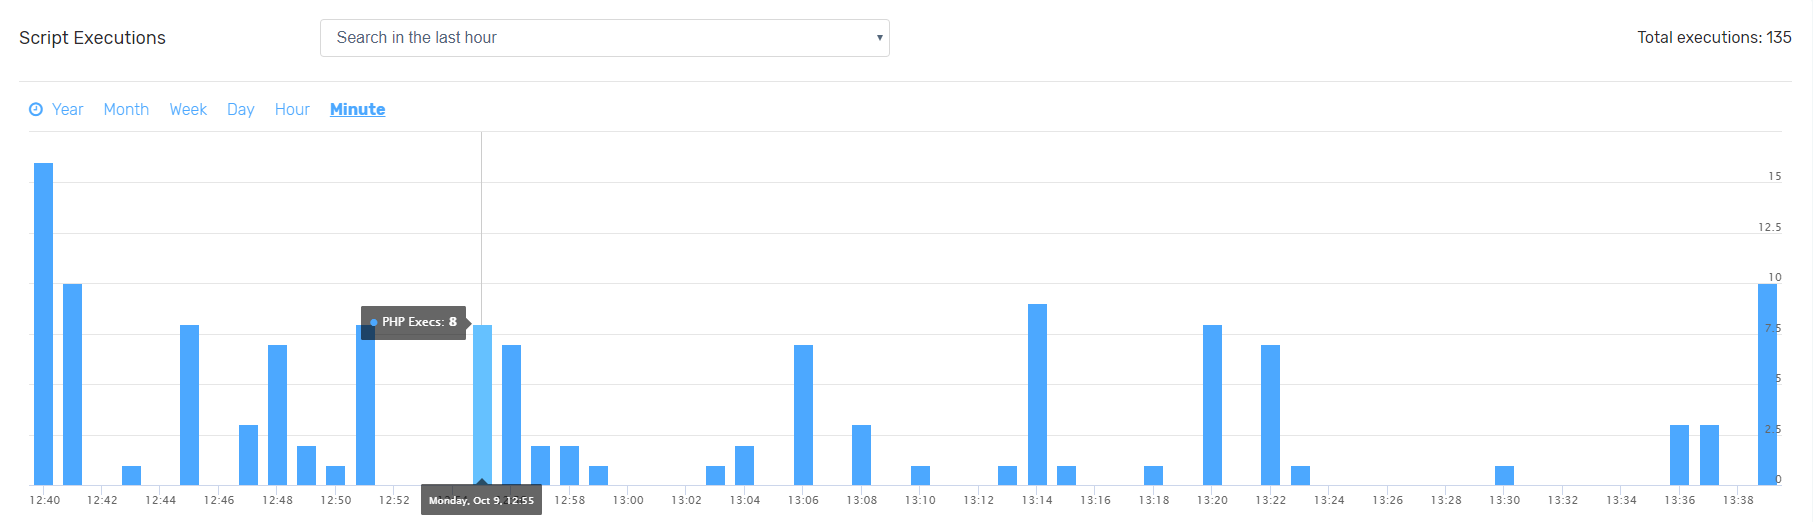
Sometimes, however, you may need more raw data to identify brute force attacks, aggressive crawlers, and bad bots. For this purpose, you can use the different views available in the Observer system. Sorting the script executions by number or time will show you which files exactly were executed and how many times.
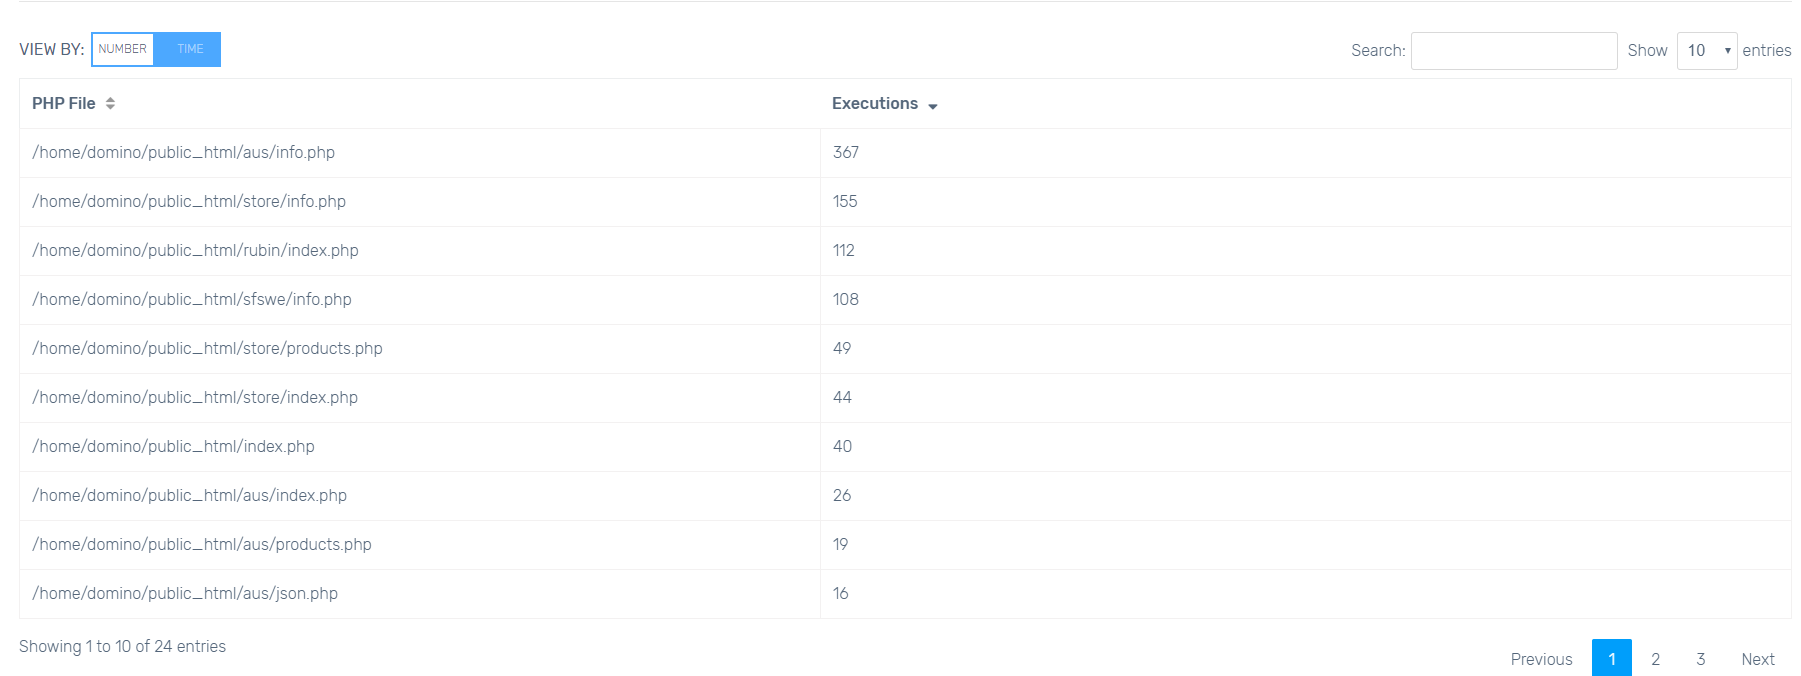
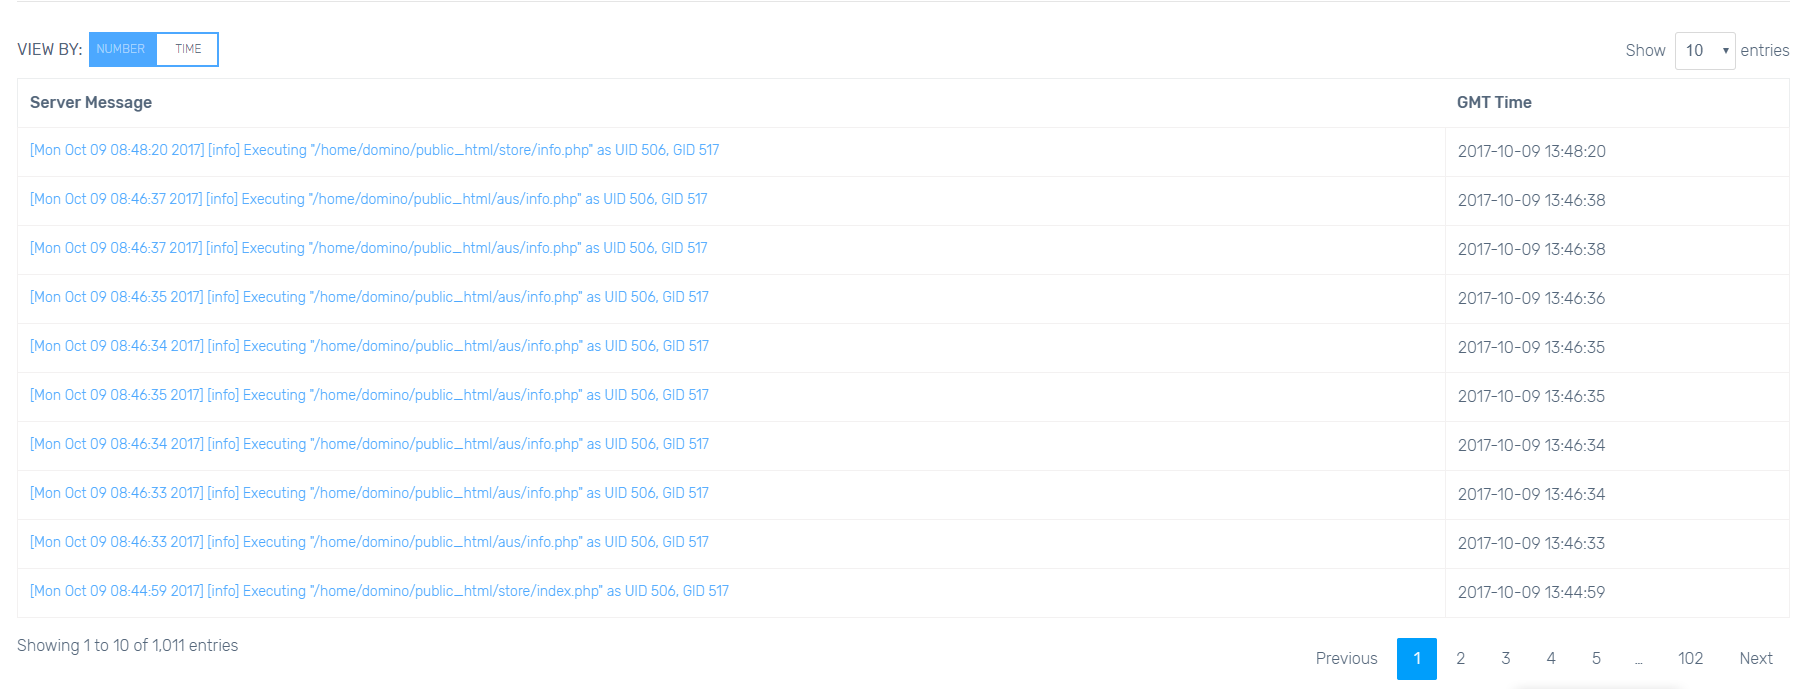
Both views can be extremely helpful to identify malfunctioning scripts or attacks when you cross-check the data with your cPanel traffic statistics. Reducing script executions by fixing or eliminating malfunctioning scripts will greatly reduce your website resource usage footprint, improve your website performance and avoid unnecessary hosting plan upgrades.
What’s Next
Now that you have access to all of this information you can start optimizing your account and resource allocation. Yet, we understand that this may be a time-consuming task, so we are building a system that will do this for you. The Report Center, that will be available soon under the Observer system, will automatically monitor your account resources and notify you if a potential issue is detected.
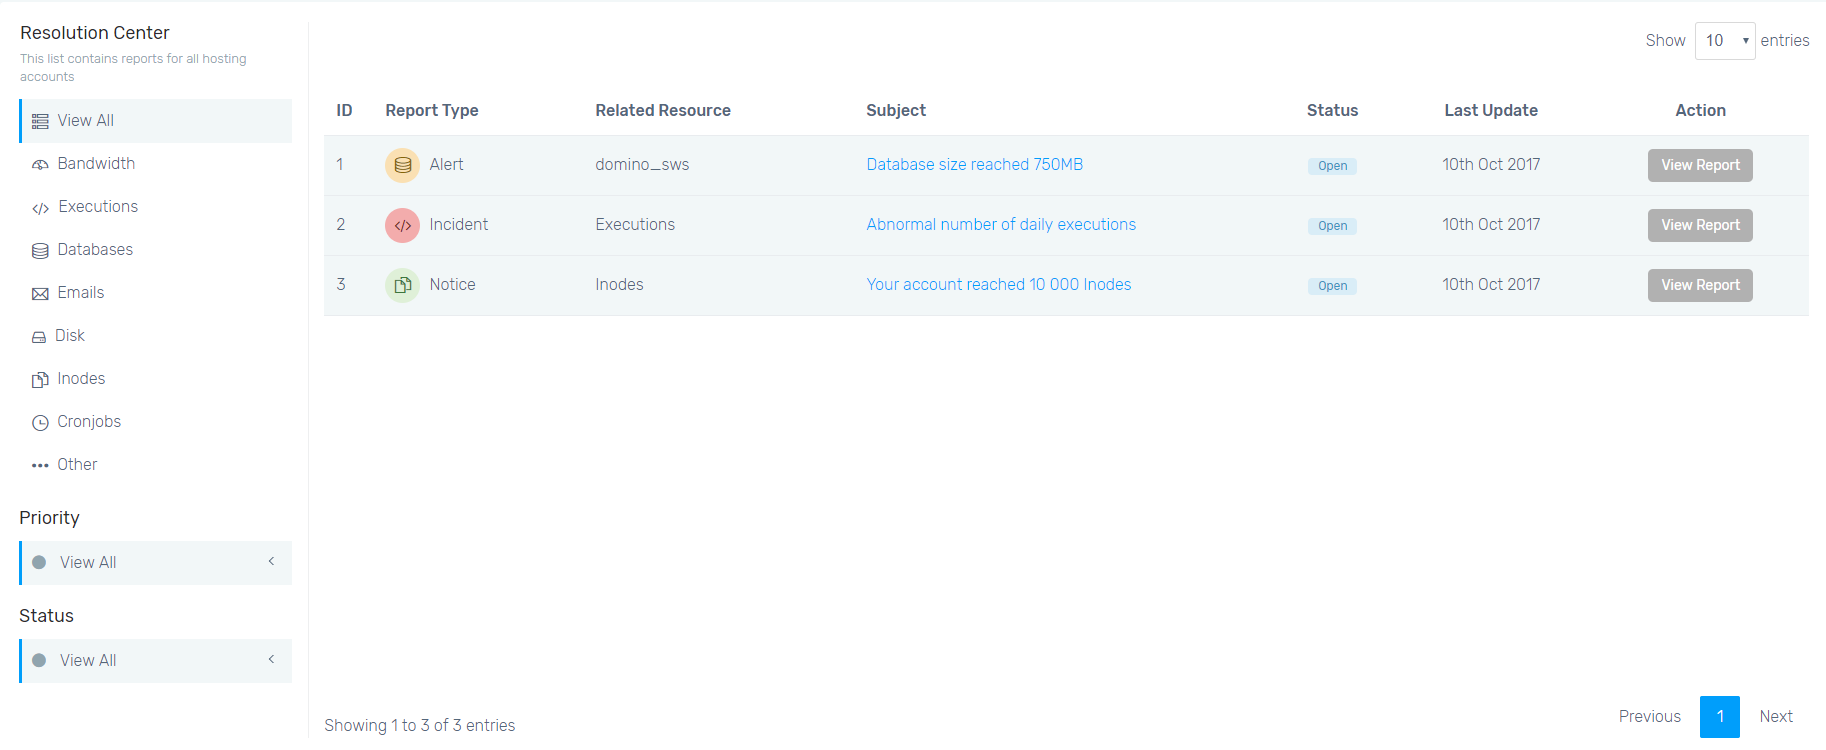
These reports will include a content-rich knowledge base with all the information one would need to investigate, resolve and optimize such resource allocation or performance issues. Of course, our 24/7 technical support team will be also available if you need some extra help.
And this is just the beginning, as this project has a long road-map, we will continue to introduce new features and polish it along the way. While the system is in beta, you may notice some bugs or widget performance issues. We are constantly working on improving it, so we eager to hear your feedback. Also, keep an eye on our blog for announcements on new features as the system is under active development and new content will be added weekly.

The latest tips and news from the industry straight to your inbox!
Join 30,000+ subscribers for exclusive access to our monthly newsletter with insider cloud, hosting and WordPress tips!
Georgi has a decade of experience as an executive and entrepreneur in the infrastructure and web hosting space. He is responsible for leading FastComet’s evolution of our scalable cloud, powering the business with Big Data, and linking the latest advances in technology to FastComet’s cloud and IT strategy. As a technical guy, he used his expertise to collect the know-how of creating a reliable and customer friendly hosting company to satisfy the increasing demand of clients.


No Comments