How to check your Bandwidth Usage in details
Updated on May 8, 2018
The devil is in the details, and this is especially true for the bandwidth consumption of your hosting account. Maybe you have a certain image that is being viewed thousands of times? Or on a certain day your website spikes in views on a certain page? These are just some of the examples we can give about abnormal bandwidth activity and if you know how your website's visitors have behaved in the past you will be ready for any similar future situations that may occur.
Before you start analyzing the data for your website available in Awstats, you should consider familiarizing yourself with the most used terms:
- Unique Visitor: A unique visitor is a visit from a unique IP (host). Even if you have multiple people using the same computer/router and are visiting one or multiple pages on your website, as long as the IP stays unchanged this will only count as 1 unique visitor.
- Visits: The visits represent the different sessions your users have. If one unique visitor accesses 5 of your pages in a row, this will be counted as one visit but if he closes your website and then opens It again it will count as two visits.
- Pages: The number of pages visited by your visitors
- Hits: One hit represents 1 file being fetched from the web server. So if a visitor accesses a page with 2 JavaScript and 2 other files, the total hits from visiting that page will be 4.
- Session Duration: The time a visitor spent on your website in the span of one visit. Do note that some visit durations may be marked as unknown when a visit happens in-between updates of Awstats information or if it occurs in the last hour of the month.
Sections' Quick Access:
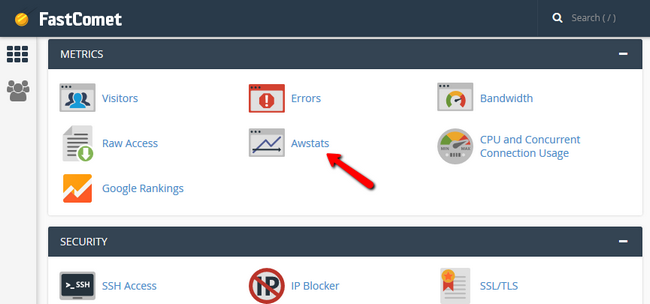
To access the detailed information about your website's bandwidth you will once again have to start by log in your cPanel account. From there navigate to the Metrics → Awstats or simply search for Awstats n the search bar located at the top of the page.
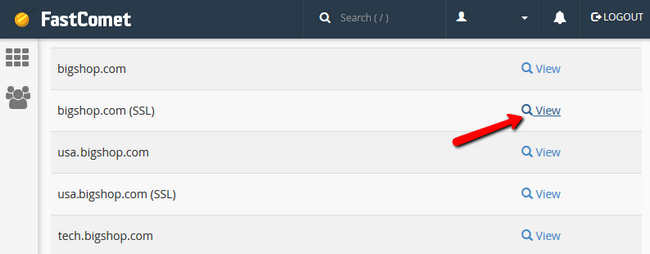
Here you will be provided with a list of all the domains and subdomains currently residing in your account. Do note that you will see both the HTTP and HTTPS versions of your websites if you have an SSL certificate installed for set domains. This is important because if you force the HTTPS connections to your website, all of the bandwidth will be generated in that "version" of the website shown here. Click on the View button when you have found the website which you want to check on.
The Awstats may look a bit old school, but then again, it provides all of the bandwidth information you might need, wrapped neatly and with an easy to access panel on the left side of the page.
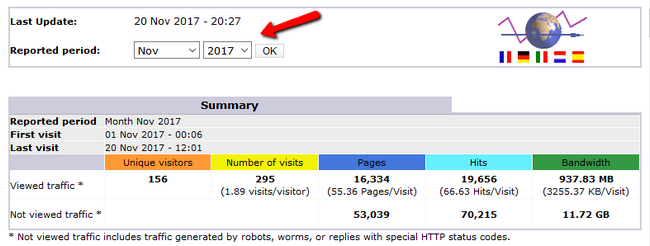
The first thing you will see on top of the page is the reported period selector from which you can choose for what duration period to get your statistics. There will also be a summary of the number of visits, hits, and bandwidth used.
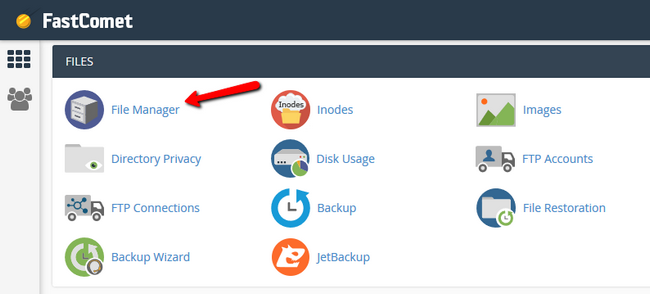
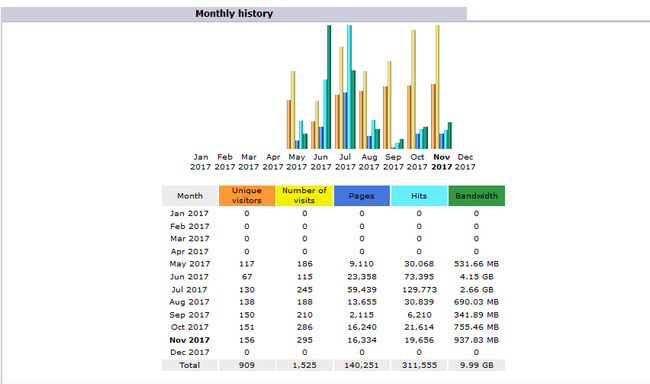
The monthly history is similar to the one shown in your cPanel. However, here you can much better understand your traffic as you can see exactly how many visitors did a certain amount of hits on your pages and the corresponding bandwidth. To update the statistics to the latest available, you will have to enable the Update Now button which is disabled by default. To do so, you will have to access the cPanel File Manager.
Now navigate to the following folder:
/home/username/tmp/awstats/
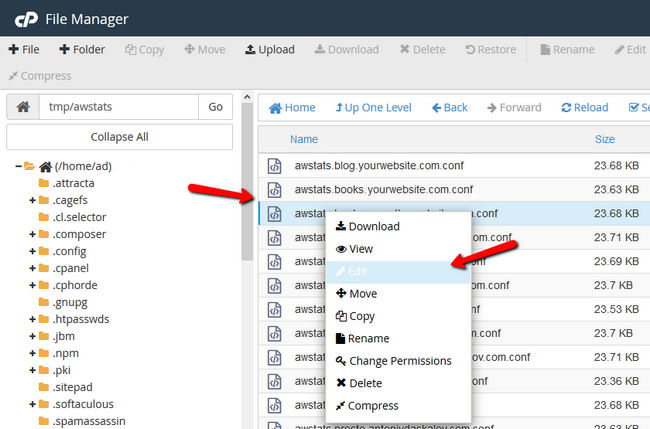
Here, if you have multiple domains and subdomains, you will see their configuration files. Right click → Edit on the .conf file for the domain which you want to enable the Update button.
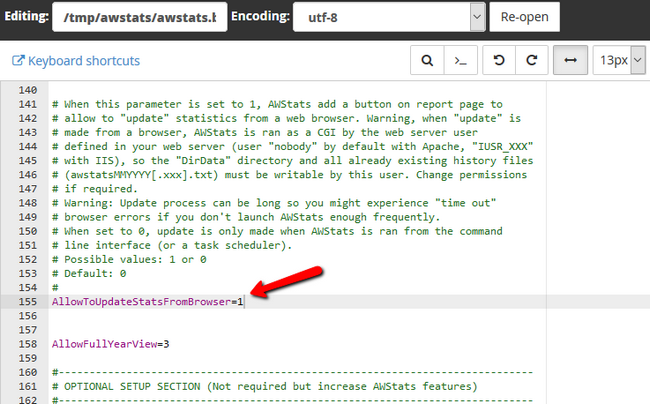
Now you will have to find the following line and change the value to 1:
AllowToUpdateStatsFromBrowser=0
Click on the Save Changes button before exiting to apply the change.
Now re-entering the Awstats for that domain or refreshing the same page will result in the Update Now button to show next to the Last Update date.
Monthly, Weekly, Daily and Hourly History
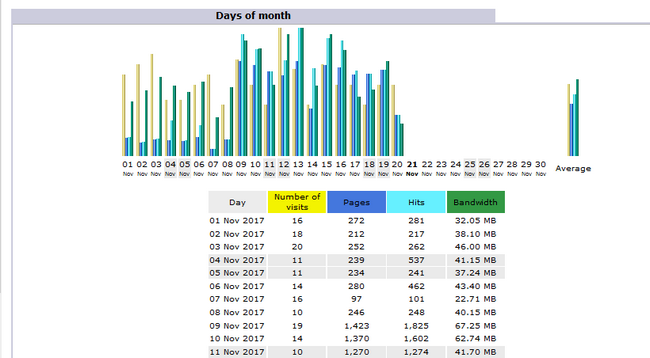
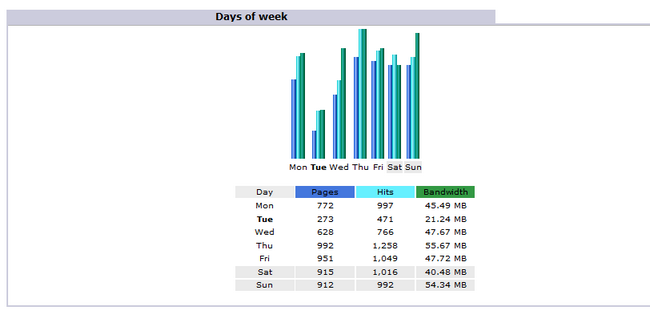
The same information can be seen for each of the days of the month
The next chart shows your traffic for each of the days of the week. This can be useful if you are running events or promotions on specific days or if your website is tailored to providing news for/from a certain day of the week.
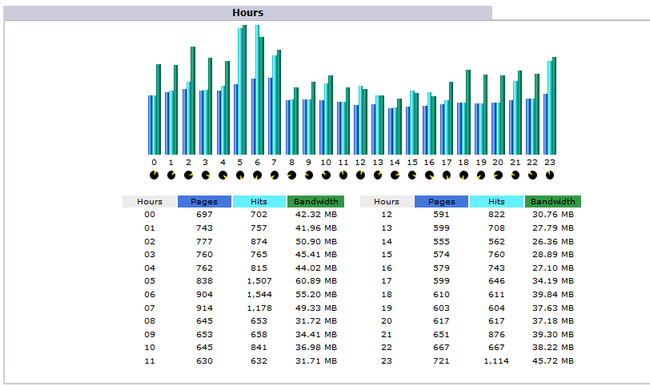
To check in which hours the traffic on your website is most dense, you can check the Hours chart. If your website's target group is adults from your country for example, you will see an increase in traffic after 5 PM since most of the users from your target group will still be at work before that hour.
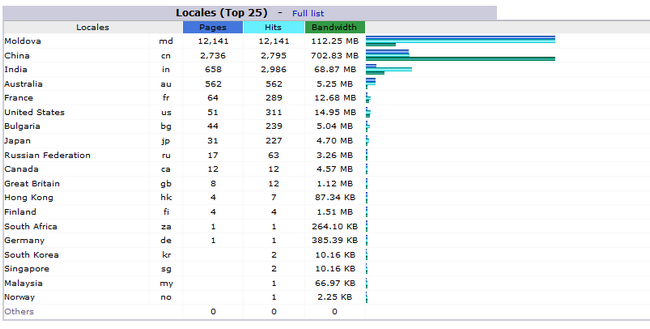
Locales
The next few charts are quite important as in them you can see potential shifts in bandwidth usage and even attempts to hotlink your content. In the country chart, you can see users from which countries favor your content.
Hosts
The hosts (top 25) chart will show you the IPs of the visitors and the number of hits and bandwidth they have generated.
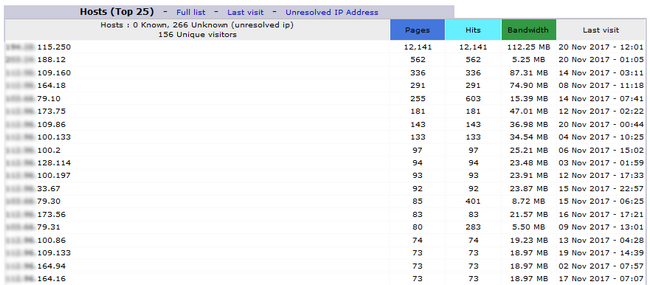
For our example, using this chart and the previous one we can conclude that there is only 1 visitor from Mongolia that made all of those hits, which is strange and might lead to us removing access from that IP if this continues in the future.
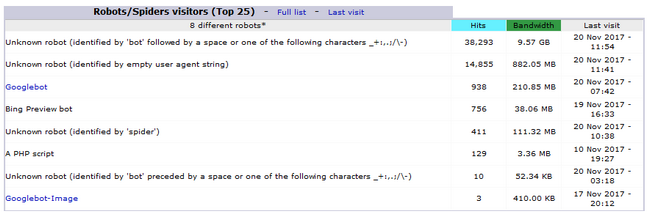
Robots/Spiders
In the Robot/Spiders visitors, you will see a list of all of the search engines and possible bad robots which crawl your website. Note that these values are not listed elsewhere in your Awstats so they can be treated as a completely separate statistic just for the non-human bandwidth generation on your website.
Visits Duration
The visits duration can show you how engaged your viewers are with your content. If the average visit duration is short, it could either mean that the average visitor either doesn't find what he is looking for or that he finds it too quickly. However, it is not always bad to see lower durations as it largely depends on the type of website which you host. For example, if you have a website about poetry and you have uploaded a lot of page-long poems, your visitors' visit duration will likely be much higher than if you host a dictionary website where people check a word's meaning in 5 seconds and then close the connection.
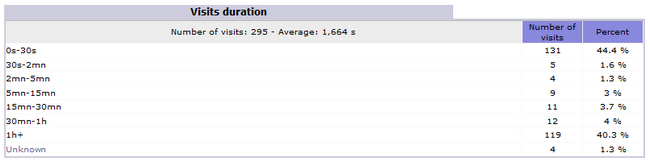
*Also, do note that no logging method is perfect. Just as you can see anomalies in the Google Analytics tool where visit/session duration can be 0 even if the user has stayed longer, the same can apply for Awstats' visit duration.
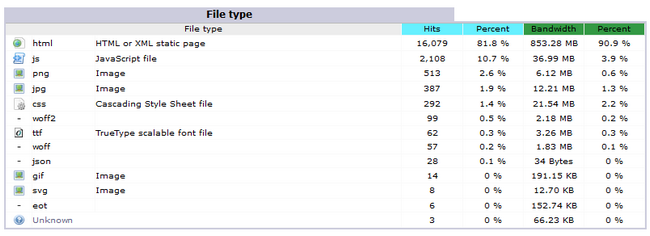
File Type
Now on to the next chart. The file type chart will show you what content types on your website is generating bandwidth. If you have an image heavy website, most likely the image type will be the one generating the majority of the bandwidth. If you are overusing bandwidth, you can easily improve such websites by optimizing your images or completely moving them to a subdomain with enabled Cloudflare which will fetch all of the images on demand from the CDN instead of the web server.
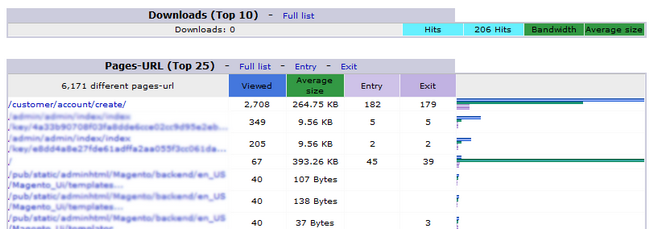
Downloads
The Downloads chart will show the downloadable content on your website and how many times each of your resources have been downloaded. In our case, this chart is empty as we have no downloadable content available.
The Page URLs also provides important information. Here you can see if for example, your login form is being brute forced or if all the traffic you get goes through a specific page which you can exclude in order to lower your bandwidth usage. In the example given here, we were running a store, which made the account creation page the most visited one.
Now armed with all of the statistics you can think of, and ways to pinpoint irregular bandwidth usage, you can take measures in order to keep your website in optimal condition.

Optimized SSD Web Hosting
- Free Domain Transfer
- 24/7 Technical Support
- Fast SSD Storage
- Hack-free Protection
- Free Script Installation
- Free Website Transfer
- Free Cloudflare CDN
- Immediate Activation