
FastComet Pro-active Server Monitoring is Here!
They say you can tell a lot about someone by the company they keep. All of you who are true fans of FastComet, know the whole story behind the brand. Coming from system administration services for private and business individuals to public cloud hosting services, we have walked a long way to come to the point where we can assure our clients that their sites would perform much better under all circumstances.
What Have We Learned Along the Way?
During last year, there have been significantly more new cloud hosting accounts that were opened with FastComet, in addition to a threefold increase in the upgrades that were made on existing cloud servers for the last half a year. So, we took some time and analyzed our users’ behavior and how we could improve our service even further. With the most current release of our entirely remodeled and improved VPS and Dedicated server cloud platform, we rolled out a dramatic update on space, RAM, CPU, and bandwidth at the same price point.
After the successful launch of the new Observer system, system which expanded visibility upwards to an advanced Resource Monitoring service, providing 360-degree information on all core hosting account resources, it was time to ensure that our cloud plans got some love, too.
Our in-house constructed Server Monitoring is an additional piece of art of the FastComet DevOps team. The main idea behind it is to improve everyone’s awareness in regards to system health, while additionally minimizing the response time when the usage is not inside the expected levels. With that in mind, we designed Server Monitoring to easily keep up with your server’s performance.
Introduction to FastComet Proactive Server Monitoring
FastComet Monitoring is a free service. It offers insight into resource usage across one’s infrastructure. Monitoring gives all administrators that necessary information with graphs made specifically about the health and integrity of the servers like utilization of the CPU, data transfer, and disk usage activity. It is especially lightweight and is able to analyze the server status with a much higher rate than standard monitoring systems.
In order to have access to the panel and lots of other benefits, simply enter your FastComet Client Area. Select the Observer item on the left-side menu, or click the “Resource Monitoring” button next to your Cloud VPS/DS server. This will take you to the Observer Dashboard, where you can use our new Monitoring system.
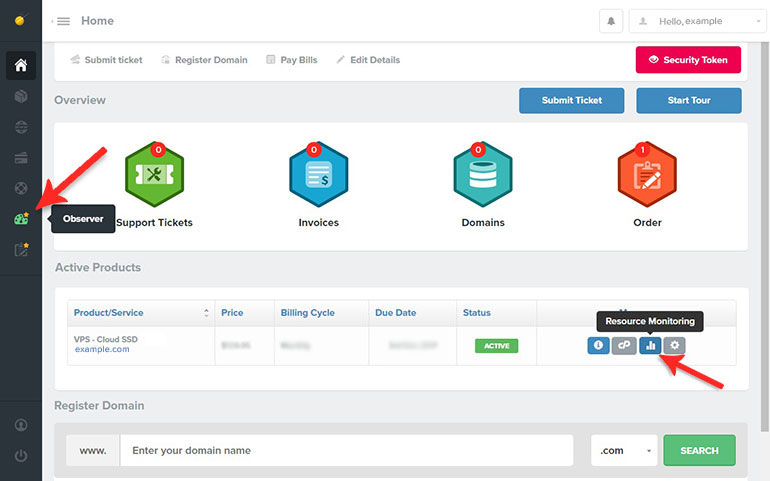
Application developers and server administrators who manage a lot of services usually need to quickly determine the status of many servers at once. The Observer Dashboard page shows a list of every server currently reporting, along with the three key server metrics (CPU busy, Memory used, Disk space used) and a graphical “traffic light” that tells you at a glance what the overall health of the server is. All three are shown as a percentage, where higher numbers are bad. This makes them easy and quick to compare across different servers.
Real-time Summary Dashboard Overview
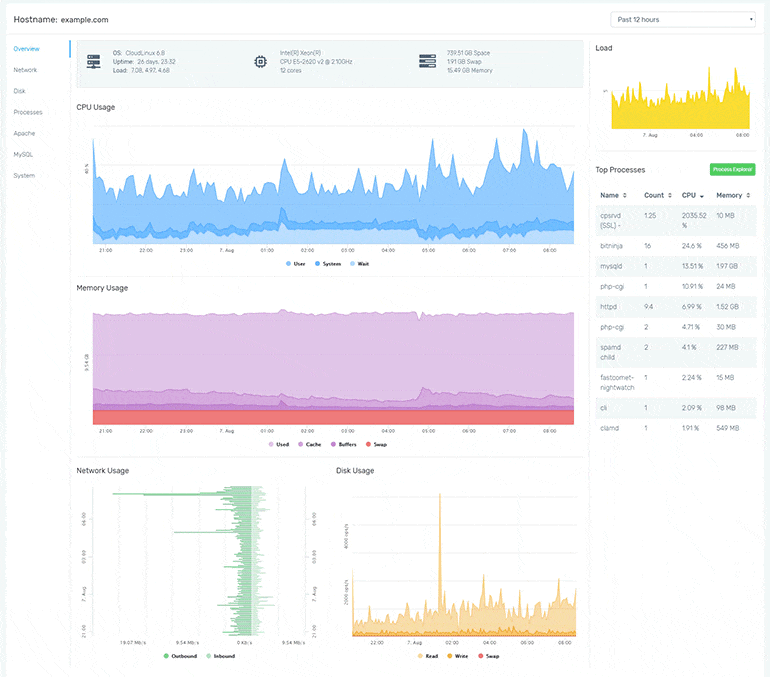
To dive into the in-depth reports you will want to click on the “Details” button above the breakdown report. In the Overview page, you have various different graphs that will show you statistics about your server that was gathered over time. Monitoring graphs are visually representing the system-level metrics in order to provide the highest possible level of the overview on the resource usage.
- Server Info
Your summarized server info is conveniently located at the top of the Dashboard to get all of the needed information regarding OS, Processor type, and Disk capabilities, right at your fingertips. Find out about how your server performs with the help of live statistics of its uptime and the average load on the system which is calculated over three periods of time options – 1, 5 and 15 minutes.
- CPU Usage
CPU utilization measures the amount of processor that’s being used at a given time. It’s shown as a percentage.
- Memory Usage
Memory utilization calculates the amount of memory consumed on the used server. This also is displayed as a percentage of total available physical memory.
- Network Usage
Bandwidth is the measurement of traffic (incoming and outgoing) that passes through the server’s network.
- Disk I/O Usage
Disk I/O, or input/output, is what measures the read and write activity that the disks on the server experience. This is shown as operations per second.
- Load
Server load is not simply a value. It’s the actual number of processes in the queue for access to the processor. Generally, it’s in “x.xx” format and has values starting with 0.00. The smaller the number over time, the fewer processes would be waiting, therefore tying up all vital resources. Also, high numbers would indicate a serious decrease in the performance of the used server.
- Top Processes
In this panel, you will find the current top processes that run on your server. You can see additional details for any process consumption by clicking on Process Explorer.
Triggering Monitoring Update
You can choose to view the data in half an hour or 12-hour view for any of your Cloud VPS/Dedicated Services. Just choose any of the options that you desire from the drop-down menu which is at the top of the Monitoring page. Select instant manual update or set a trigger to update in every 1, 2, 5, 10 or 30 minutes. The minimum level of detail that ’s supported by Monitoring is 1-minute data points.
Once this is done, the statistical data shown in the graphs below would display the info you have selected. On the graphs, you can see multiple plotted points. If you hover over one of the points with your cursor it will display data that is specific to the said point on the timeline.
Digging Deeper
Once an abnormal activity/issue has been detected, it is time to dig deeper. If Disk IO is high, which disk is the one having trouble? If the CPU is busy, what is it busy doing? The starting point for any of these questions should be the Overview page for the server in question.
The purpose of this page is dual. On one hand, it needs to make it clear to the server administrator when something is not right. To accomplish the first goal, we have used a consistent 100% max for the CPU, Memory, and Disk I/O charts, and have tried not to overload the summary dashboard with too many charts.
This page is also the starting point when troubleshooting an issue. To accomplish this second goal, we have a relatively dense right-hand column and have included some context information in addition to actionable performance data. Of particular note is the Processes table, which functions as the “top” command and tracks the top 10 processes in terms of CPU and Memory usage.
Watch server KPI and drill down to details if needed. It would help you comprehend the way your resource usage keeps changing over time, in addition to how different resource levels correlate, and which processes are contributing to those levels. Often we don’t need to go any further than this page when we are trying to diagnose a problem where either CPU or Memory resources are being exhausted. The Disk I/O and Network charts, and the Processes table are also jumping-off points to their respective detail pages. On those pages, you can see additional details (disk Reads vs. Writes) broken up by specific disk device or network interface.
Deep Diving into Monitoring Metrics
It’s essential for you to understand the state of your infrastructure and systems, in order to be sure about the high level of stability and reliability of your environment. Information about the health and performance of your servers not only helps you react to all kinds of issues, but it also provides you the needed security to make certain changes with confidence. One of the most efficient approaches for gaining this insight is exactly with a robust Server Monitoring system. It gathers metrics, visualizes information, in addition to alerting server administrators when things appear to be abnormal.
The resources and services monitored by the Server Monitoring are separated into six broad categories. To find out more in details in regards to the resource usage, click on the categories. Expanding a category shows all active and former reports about every resource and service included in the category. The beta version of the Server Monitoring system provides up to 12 hours of data retention.
We’ll dive into each section of Server Monitoring and share some examples (and real-world scenarios) of how you can take advantage of these new reports when you are looking to analyze faults in the network, availability, as well as performance issues as quickly as possible.
Network
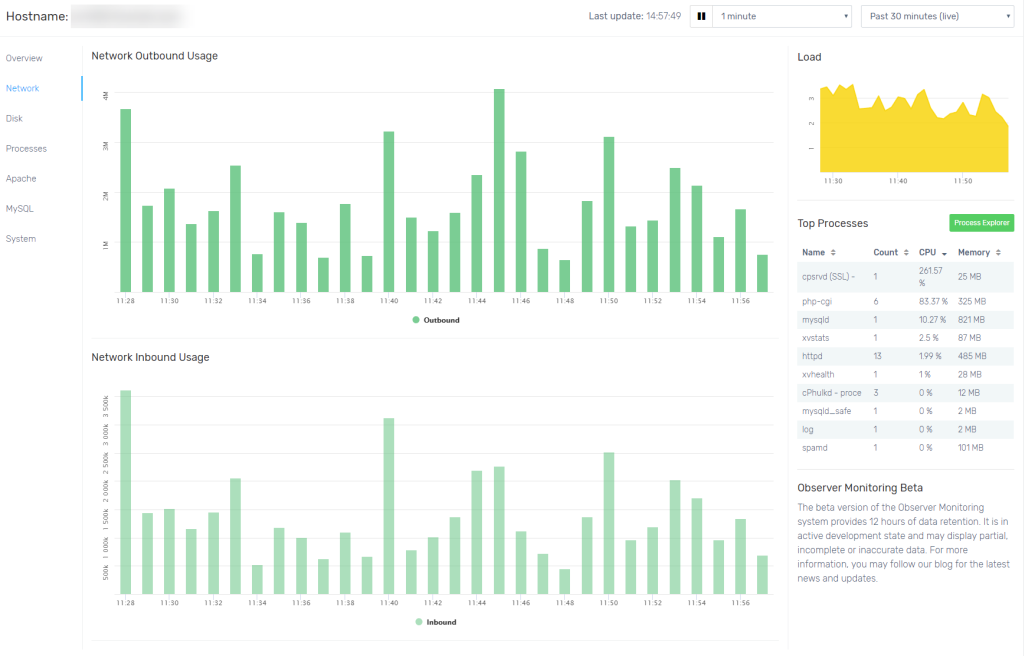
An increase in traffic is usually a positive thing, signaling that your marketing efforts are being paid off and that your brand is being well received. However, when high traffic to a website is sudden and unexpected, this can cause issues with functionality. High load average statistics imply that the system is overloaded; lots of processes are waiting for CPU time.
More than a few variables can cause issues in the network. They often make the whole process of finding the root problems cause not very easy. Continuous network monitoring assists you in detecting bottlenecks and catching possible failures at an early stage. It also helps to troubleshoot them before they cause unwanted downtimes.
Common issues:
- Unstable bandwidth
- Long response time
- Intermittent network connectivity problems
- Poor performance with applications or services
If you want to dig deeper and find out how fast the web servers are responding, use the network analyzer. It tracks and displays both current and historical performance metrics in dashboards and charts that are customizable.
Keep an eye on:
- Sudden peaks in sent/received traffic
- Large amounts of sent/received traffic
Disk
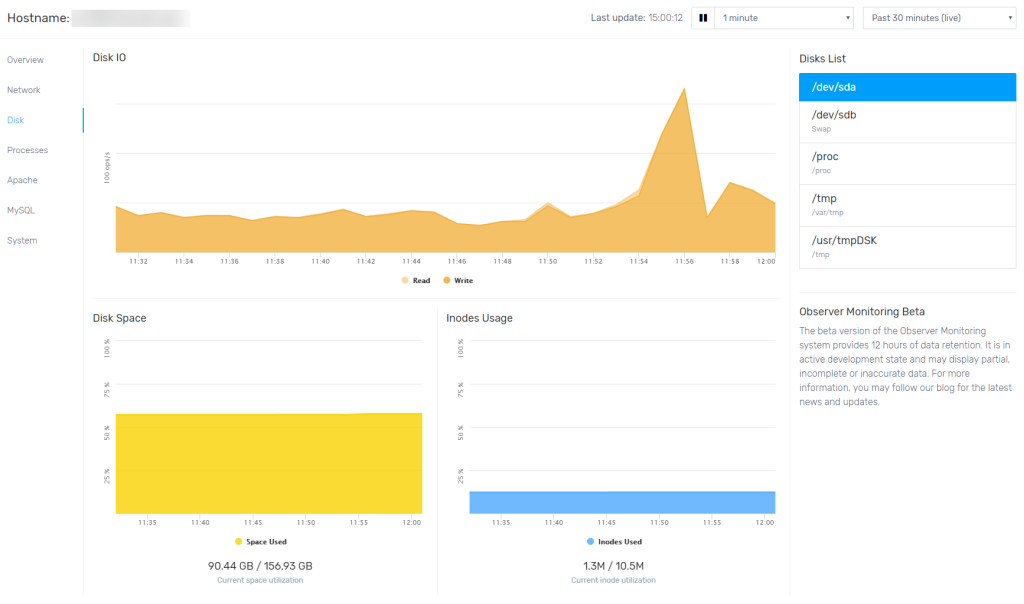
With the expanding of data volume, response time could grow as well. That happens because applications required to read/write data are inefficient when there is low disk space. Insufficient disk space directly affects the ability of a server for growing the paging file and can negatively impact virtual memory management. These inefficiencies could slow down the whole network, cause failing in transactions, grind websites to a halt and result in a variety of headaches in general.
Keep an eye on:
- Disk space used
- The rate of increase in disk space utilization
- Disk speed per second (reads, writes, and transfers)
- Average disk queue length
Find out what’s going on under the hood!
- Disk IO
FastComet breaks disk I/O down into read and write operations. They are handled separately. Server monitoring graphs show them as two separate lines on the Disk I/O graph.
- Disk Space
Disk usage is a calculation of the amount of disk space that’s currently being utilized. This is displayed as a percentage of the server disk space available in total.
- Disks List
This value takes into account the server’s root storage and all additional attached disks. The values of each disk are bundled up into one single value representing the total storage space of the server.
- Inode Usage
Disk input and output (I/O) bottlenecks can happen when a certain application or service is reading/writing a large amount of data to disk and the processor needs to wait to process the information. High I/O wait could significantly slow down a server.
Processes
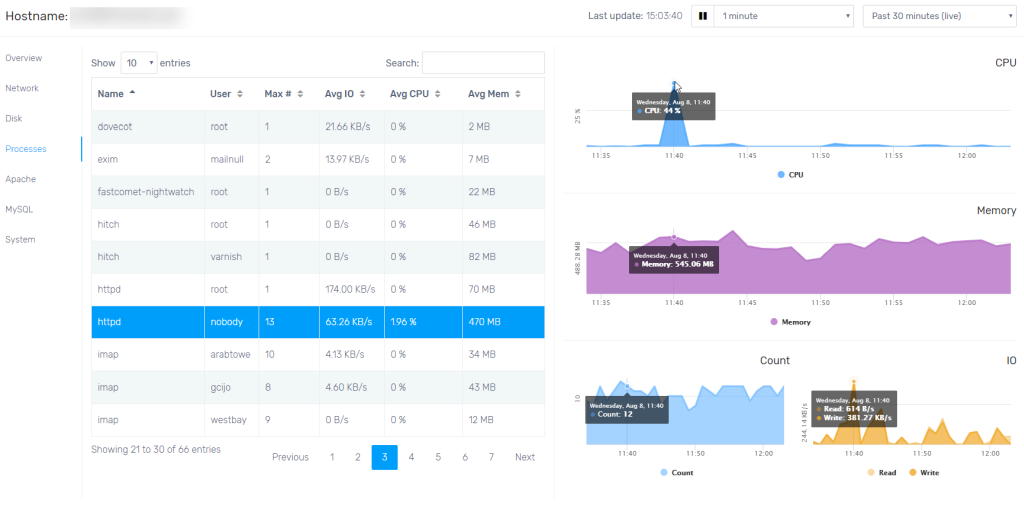
As an administrator responsible for keeping your server systems up and running, you need to be aware if something is going wrong. Additionally, Server Monitoring provides reports about the highest consumers of CPU and memory in the form of a chart within the Processes section graphs. The processes are being sorted by the highest consumer of the chosen resource first. You can adjust these settings depending on the process value. Just select any of your desired filters from the drop-down sections and resource-intensive processes would be identified with ease.
Each process is followed by a usage percentage out of the total available resources.
Keep an eye on:
- Current memory utilization
- Number of processes and their memory usage
- Spikes in memory usage
Apache
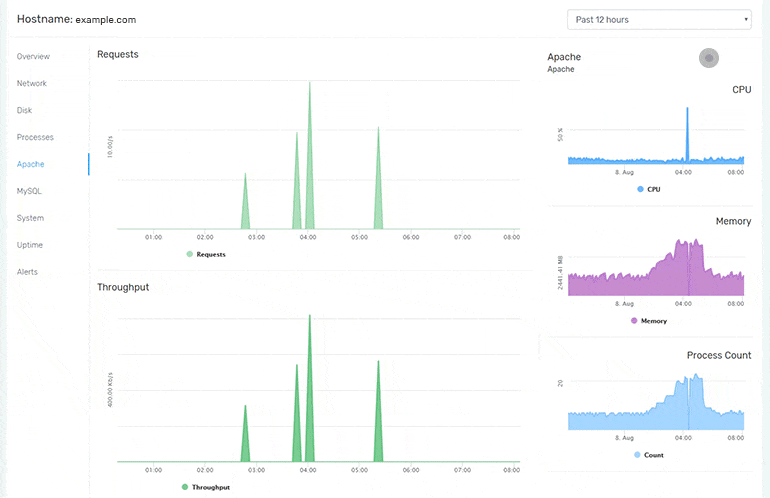
As your application grows and so does traffic towards it, somewhere along the line, a certain amount of Apache troubleshooting will always be necessary for keeping things running as smooth as possible.
Troubleshooting Apache will sometimes require you to fiddle with the Apache configuration parameters. Sometimes it’s a matter of adding system resources. And other times you’ll need to optimize some of the code running on the server. Figuring out what to do is actually the challenging part, and that’s why you need to monitor your Apache HTTP server.
MariaDB
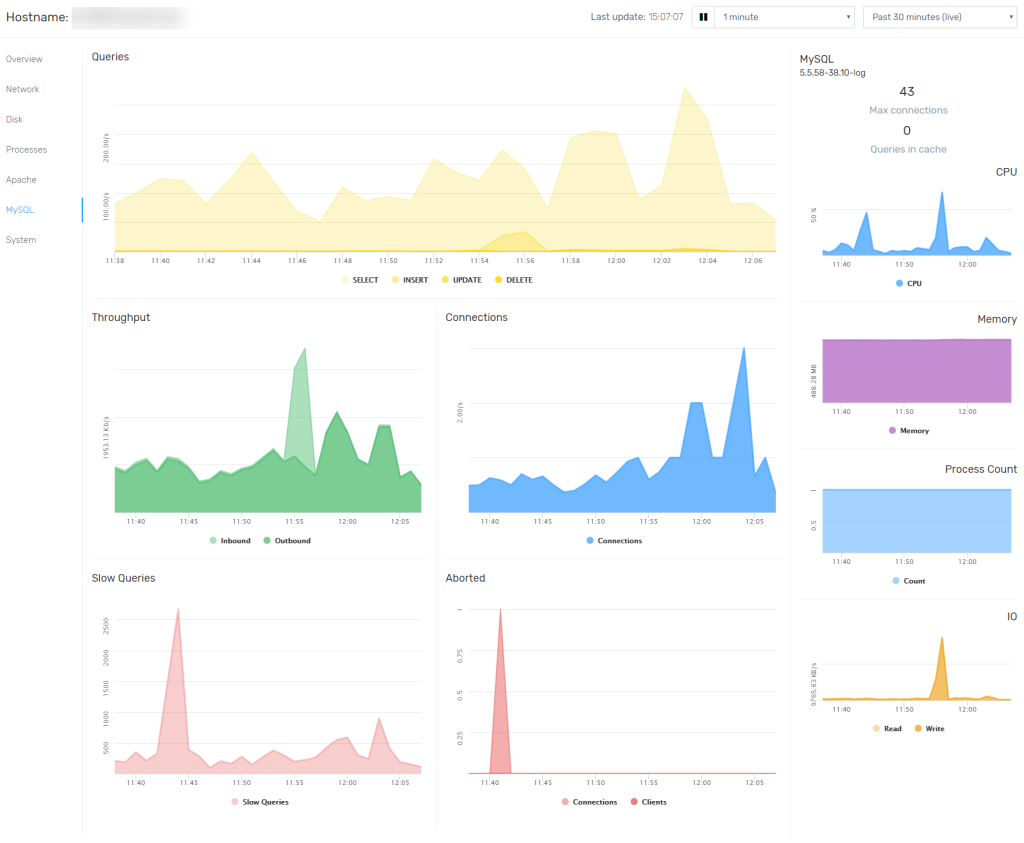
The MariaDB databases running on your Cloud VPS/ Dedicated server are an integral part of many content management systems, like WordPress and Drupal. It’s also very important to keep monitoring the connection to your database. Not only should you keep all software up-to-date, but also run regular data hygiene state. This is in order to ensure that no intrusions have been made that could have compromised your database security. One of the most regular attacks to watch out for is the SQL attack. It can be avoided with ease by performing regular maintenance and taking preventive measures, but it’s important to often seek out any possible intrusions within your own database. Unusual activity or unfamiliar commands are a great indicator that you may be compromised.
System
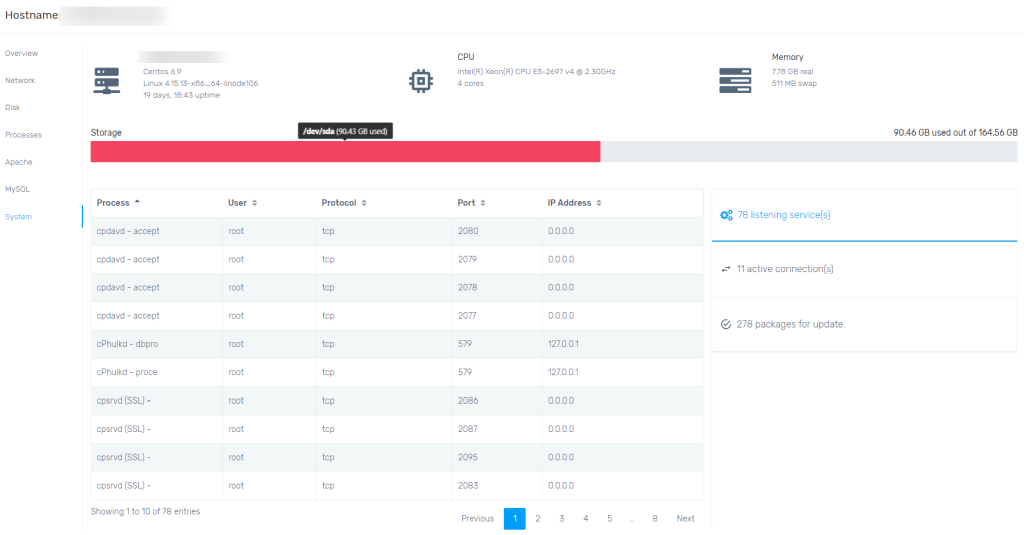
Linux distributions are frequently updated to fix bugs, add new features, and patch security vulnerabilities. System monitoring section proactively identifies which packages are up for an update, no need to run manual yum update checks.
Free Plan/Upgrade Plan
Our free plan is exclusively for VPS, cloud and dedicated servers hosted with FastComet and are enabled by default for all existing clients. The beta version of the Observer Monitoring system provides 12 hours of data retention. It is in active development state and may display partial, incomplete or inaccurate data. Stay tuned for additional features and improvements to our monitoring system that will help you monitor any aspect of your service with ease.

The latest tips and news from the industry straight to your inbox!
Join 30,000+ subscribers for exclusive access to our monthly newsletter with insider cloud, hosting and WordPress tips!
Elena oversees all Marketing, Product Management and Community efforts for FastComet and is in charge of telling the brand's story. Always pitching, she’ll share the FastComet vision with anyone who’ll listen. Elena helps our customers make the most of their web sites' and focuses on our inbound marketing efforts; everything from developing new online growth strategies, content creation, technical SEO, and outreach within the FastComet community. Her background includes Sales and Customer Relationship development, as well as Online Marketing.


No Comments